SNAP
Where can I download SNAP?
SNAP and the toolboxes can be downloaded from the STEP web page at https://step.esa.int/
How to update SNAP?
Updating SNAP via the GUI is easy. Simply select the menu entry “Help / Check for Updates”. This will check if updates are available, if so you just need to follow the wizard.
If you want to update SNAP via the command line, then please follow this guide Update SNAP from the command line
What are the minimal requirements for SNAP?
To give minimal requirements for SNAP is not easy. It depends very much on what you are using SNAP for. It depends on which data you use, medium or high resolution, and what kind of processing you perform.
As for the CPU, the faster the better. But for the memory you can use SNAP starting already with 8GB of RAM, even 4GB would work for small low-resolution data. In general, we would recommend having at least 16GB of memory. For some processing operations, e.g., SAR processing it is suggested to have 32GB or more.
If you do not meet the memory requirements for your use case, you will see errors like those described in this FAQ-entry:
How should I cite SNAP?
If you want to cite SNAP you can use the following suggestion:
SNAP - ESA Sentinel Application Platform v{LATEST-VERSION}, http://step.esa.int
A specific Toolbox can be cited like:
S1TBX - ESA Sentinel-1 Toolbox v{LATEST-VERSION}, http://step.esa.int/
Just replace {LATEST-VERSION} with the actual version, e.g.
SNAP - ESA Sentinel Application Platform v6.0.7, http://step.esa.int
S1TBX - ESA Sentinel-1 Toolbox v7.0.1, http://step.esa.int/
What to include in a forum post when reporting an issue?
Before you open a new topic, please use the search function of the forum to check if your problem is already discussed in existing topics. To keep the forum structure clean, please consider continuing discussions in existing topics before creating a new topic on similar issues. Once your post has been submitted, the corresponding topic will automatically be visible at the top of the topic list.
When reporting an issue, try to include as much information as possible to allow developers to reproduce the problem including:
Toolbox version and operating system, amount of RAM
Identify the relevant satellite products by giving the full name of the product
List the exact processing steps needed to recreate the issue
Attach relevant screen captures and resulting images (copy and paste function)
Attach the log file to your post. You can find it by selecting from the menu Help / Show Log Directory.
Make sure to reproduce the error first and then attach the messages.log file.In case you processed a graph file, please upload the XML as well (using the upload button)

It also helps to understand when you shortly describe your overall aim (e.g. water change detection, vegetation monitoring...)
In case you get an error message, please include it in your question (again, please also check the search function if this error message has already been reported/solved)
If you work with multiple products, please mention if the error occurs for all of them or just for one specific product.
What does the “dl” unit mean?
The dl means dimensionless. The variable has no unit.
https://en.wikipedia.org/wiki/Reflectance#SI_radiometry_units
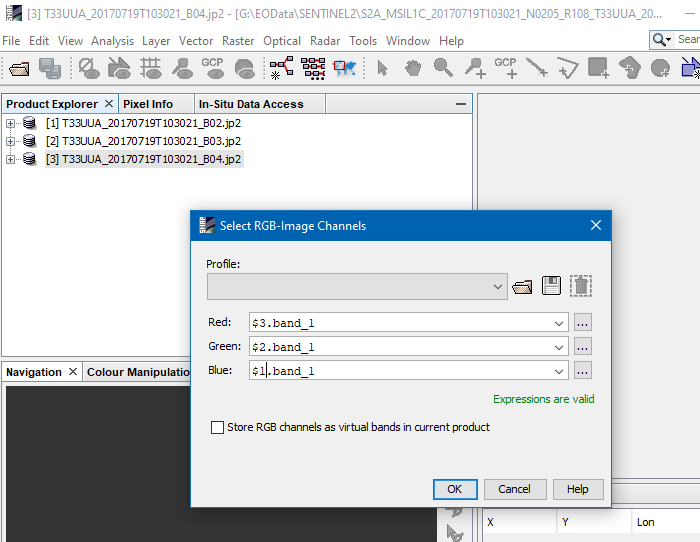
How to create an RGB composite from individual bands?
When having 3 data products with the individual bands for the channels of the RGB image you want to create, you needed to reference the products in the expressions of the RGB Image creation dialogue.
Right-click on one product and select “Open RGB Image Window“. In the example image, all bands have the same name ‘band_1' and you have to reference the correct product for the channels. Each product has a reference number which you can see in the Product Explorer. To reference ‘band_1’ in product 2 use the expression '$2.band_1'.
That’s the quickest way.
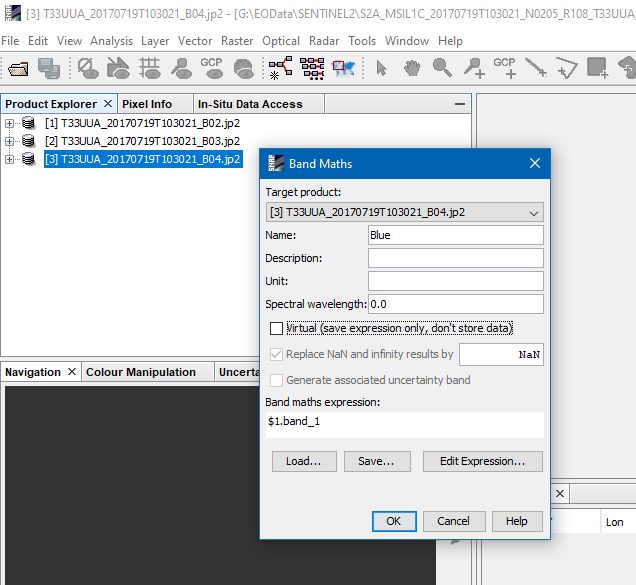
Alternatively, you can copy all bands into one product and save it for later use.
Therefore, you open the Band Maths and use one of the products as the target. To copy the other bands, use the same expression as in the RGB Image dialogue. Make sure to disable the Virtual option.
You can also specify a new name for the copied bands. Finally, you change the name of the already existing band in the target product and then you can save this product. To create an RGB now, you just open the RGB image dialogue and select the bands. If you name same Red, Green, Blue, they get automatically selected.
All bands need to have the same size. If they have different sizes, you need to resample them to a common size. You can use the resampling operation to do this.
Why are RGB Images differently colorised and not comparable?
The different results of the RGB image creation results from the process how SNAP creates images.
The value range of a band is taken and clipped by 2.5% at the upper and lower end of the range. This is done to remove outliers.
But still the ranges can vary from image to image. SNAP now uses this range to create the image and creates the colour stretch. This leads to the different results.
You can overcome this by changing the colour stretch in the Colour Manipulation tool manually.
Another way of doing this is to clip the values already in the expressions of the RGB profile.
For Sentinel-2 the suitable expressions could look like:
blue=B2 < 0 ? 0 : B2 > 0.25 ? 0.25 : B2green=B3 < 0 ? 0 : B3 > 0.3 ? 0.3 : B3red=B4 < 0 ? 0 : B4 > 0.35 ? 0.35 : B4
For Sentinel-3 OLCI one could use these:
blue=Oa04_radiance < 0 ? 0 : Oa04_radiance > 430 ? 430 : Oa04_radiancegreen=Oa06_radiance < 0 ? 0 : Oa06_radiance > 430 ? 430 : Oa06_radiancered=Oa09_radiance < 0 ? 0 : Oa09_radiance > 430 ? 430 : Oa09_radiance
Here you can download the pre-defined profiles. You can load them into SNAP when creating an RGB image and save them for later use.
Actually, the same issue with varying colourisation applies to grey scaled images and not only to RGB images. Here you can use the Colour Manipulation tool to harmonise the image creation.
How to move the `.snap` directory to a different location?
For the SNAP Desktop:
Edit the snap.conf in the etc folder of the SNAP installation directory. You need administration rights to edit this file.
Inside you see the default_options string.
Add -J-Dsnap.userdir=C:\temp\mySnapDir to it or the path to another location. In the end you it will look like:
default_options="--branding snap --locale en_GB -J-XX:+AggressiveOpts -J-Xverify:none -J-Xms256M -J-Xmx11G -J-Dsnap.userdir=C:\temp\mySnapDir -J-Dnetbeans.mainclass=org.esa.snap.main.Main -J-Dsun.java2d.noddraw=true -J-Dsun.awt.nopixfmt=true -J-Dsun.java2d.dpiaware=false"
For gpt or pconvert:
Edit the corresponding gpt.vmoptions or the pconvert.vmoptions file. They are located in the bin folder of the SNAP installation directory. Simply add the line:
-Dsnap.userdir=C:\temp\mySnapDir
I have problems with the 3D World View on Linux, can I disable it?
The World Wind View causes sometimes trouble on Linux, especially in VMs. This is often caused by the 3D graphics card driver. Updating the driver might help and if you are in a VM it might help to enable 3D support. You can try to switch the World Wind View in to the flat mode. This can be done in the options panel in the World Wind tab of the General section or paste this property
snap.worldwind.useFlatEarth=true
into the snap.properties file which is located in the etc folder of the SNAP installation directory. If this still does not help you can remove the World Wind View module. Delete snap/modules/org-esa-snap-snap-worldwind.jar within the installation directory. If you then start SNAP, you get a warning that this module is missing. Accept it and let SNAP remember the decision. As a replacement, you can use the old-world map. You can find it at View / Tool Windows / World Map in the menu
See also: https://forum.step.esa.int/t/issues-observations-comments-of-snap-6-0-beta/6722/9
How can I get WorldWind to work? I see a blank window in the World View.
To use the WorldWind World Map, a 3D video card with updated drivers is necessary. Update your video card drivers. (How to update Windows drivers) (ATI/AMD – Nvidia – Intel). Some known issues exist with using WorldWind within a virtual machine such as VirtualBox.
I'm getting the error “Cannot construct DataBuffer”, “GC overhead limit exceeded” or “Java Heap Space”. What can I do?
This error indicates that you don't have enough memory. Either your system does not have enough memory (RAM) or the configuration for SNAP is not sufficient. If you have already worked with SNAP over a considerable time and many products are opened, it is advisable to close and restart SNAP and only open the product you really need for further processing. This often already releases a lot of memory and allows to continue. If this does not help, you can try to improve the memory configuration as described in the following.
For the SNAP Desktop application, you can increase the amount of memory available to SNAP (depending on how much RAM is installed on your computer). In the 'etc' folder of the SNAP installation directory, you'll find a file named snap.conf. Open it in a text editor. There is the line which starts with 'default_options='
In this line, you'll find an option like -J-Xmx5G. It defines how much of your total available RAM can be used by SNAP. By default, it is set to ~75% of the maximum value (here: 5G stands for 5 of 8 gigabytes of RAM). In case your system has more RAM, you can increase the -J-Xmx value. For 16 GB RAM, you could set the value to 12G, for 32 GB RAM to 24G and so on. For systems with more RAM, it was reported (here) that already 50% of the available RAM is a suitable setting and more effective than 75%. A second option is to increase the cache size (by default 1024) to 2048 or 4096. This can be done in the SNAP under Tools\Options in the Performance tab. This tab also allows you to find the ideal configuration of your system using a selected benchmark operator and clicking "compute". If you experience the error on the command line with gpt or pconvert you need to change different files. You need to change the corresponding vmoptions files, either gpt.vmoptions or pconvert.vmoptions (in the 'bin' folder). Change the value after -Xmx in the last line.
Related questions
How to increase memory for snappy?
You need to change the configuration in the snappy.ini file. The file is in the snappy folder. Change the line
# java_max_mem: 4G
to e.g.
java_max_mem: 6G
This means that snappy can use 6GB of your RAM. A recommended value is 70%-80% of the available RAM in your system.
How can I automate processing steps?
The Graph Builder (under Tools) lets you define entire chains of workflows, starting with reading a product and ending with writing the final output. It is documented in this video. Each graph is stored as an XML file which defines all steps and parameters in the correct order. Once you have saved an XML file you can use the Batch Processing to apply it to a list of input products as demonstrated here. To run processing chains from the command line (without the SNAP GUI), please follow these instructions: Bulk Processing with GPT. If your graph consists of many steps, please have a look at the Tile Cache Operator: How to Use Tile Cache Operator to Improve Memory Consumption
Related questions
When processing an XML graph, I get an error saying something like “unexpected character in markup”?
Some characters have special meanings in XML. If they are used for other purposes, for example in an expression they need to be escaped.
These characters are: “ ' < > &
Character | Escaped |
|---|---|
“ | " |
' | ' |
< | < |
> | > |
& | & |
An expression like this: B8 > 0 && B8 < 0.1
Needs to be written like: B8 %gt; 0 && B8 < 0.1
More details are on Stackoverflow.
How do I know how I have processed my data, with which parameters values?
The BEAM-DIMAP format (standard processing format in SNAP) stores all processing steps, including their input/output products, variables and parameters, in the metadata. You can find it in each product under Metadata > Processing Graph. Each node stands for one operation and contains sources and parameters. After every operator, the node of the WriteOp operator defines the name and location of the output product separately.
Besides the Processing Graph, there is sometimes a history folder in the Metadata section which also stores information on previous processing steps, e.g. the extents of a created subset.
Why should I stick to the BEAM-DIMAP format as long as possible?
The BEAM-DIMAP format is the default output format for all products generated in SNAP. It allows fast reading and writing of raster products, and most importantly, efficient handling of their metadata. Metadata store information on geocoding, dimensions, acquisition date, sensor specifics, etc. These information deliver important inputs for many operators in SNAP. Once a BEAM-DIMAP product is exported, for instance to a GeoTiff, many attributes of the metadata are no longer part of the raster product. Accordingly, SNAP cannot process them correctly, because meta information is missing (and cannot be restored from the GeoTiff after converting back to BEAM-DIMAP). It is therefore advised that you stick to the BEAM DIMAP format as long as possible and only convert or export it to a different format when your processing in SNAP is done.
I want to use a product processed in SNAP in another software
If you want to continue the processing or visualization of your data in another software (such as QGIS, ArcMap, ENVI, Erdas IMAGINE, Matlab ect...), you can use one of the output formats listed under File > Export.
However, exporting to other formats has disadvantages: Firstly, the BEAM DIMAP is the only format which grants the correct storage of all metadata (see the previous question). Secondly, conversion to different formats involves the risk of changes in the data type and precision (e.g. less decimal places, or 16 bit integer instead of 32 bit float). Therefore, exporting should be avoided where possible.
Solution: The data generated in SNAP is stored as in the BEAM DIMAP format. It is fully compatible according to the OGC standards and can directly read in most software packages, such as QGIS or ArcMap. Each BEAM DIMAP product consists of two elements
.dim: This file contains all metadata in a XML structure
.data: This directory contains all raster products (.img + .hdr), tie-point grids and vectors (stored as WKT)
If you want to open a raster in external software, navigate to your products location, go inside the .data folder and you find all rasters belonging to this product, stored as .img files with their corresponding header files (.hdr). QGIS, ArcMap and ENVI can directly read these products without further need for conversion.
Related questions
Why should I stick to the BEAM DIMAP format as long as possible?
Why do the pixel values differ after export to GeoTiff compared to those in SNAP?
What is a virtual band?
The BEAM DIMAP format, which is the standard processing format in SNAP, writes all rasters as .img files in the .data directory of the product folder. However, there are tools which only write virtual products:
Band Maths (unless you disable the "Virtual" option

)
Conversion from/to dB
Filtered Band... (from the context menu)
and some others.
These tools do not create a physical band but a virtual one. They are characterized by a white V in the band icon:
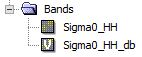
As long as a band is virtual, it is not written on your hard drive. Instead, it is only defined based on a logical or mathematical expression. You can see this in the Pixel Value Expression in the band properties. This allows you to work with raster bands without the need to store them on your drive. However, the virtual bands can only be displayed and processed as long as the bands which were used to create them are stored in the same product. If you delete the original band (here: Sigma0_HH), the virtual band is no longer usable, because the expression points to information which is no longer present. Furthermore, displaying virtual bands can take a longer time because SNAP computes them on-the-fly (which is RAM-intensive).
To make a virtual band permanent, you can right-click it and select "Convert Band". Then click on File > Save Product to make these changes permanent. The band is then also written into the .data folder of your product and can be used independently from the original band.
Related questions
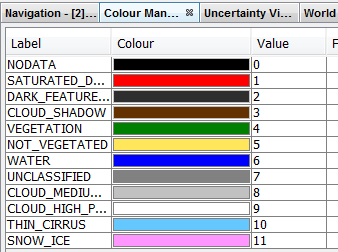
What are flags and how should I interpret them?
Flags are binary information about a certain pixel. You might now that computer data consists of bytes and bytes consist of 8 bits. Each flag is represented by one bit. 8 flags can be stored in one byte.
Each of the flags (bits) has a special meaning. Usually binary information. The flag indicates if the corresponding pixel is a land or a water pixel or if it is cloudy or it has been processed in a certain way.
Assuming we have a byte, which contains 3 flags.
Meaning | Bit 2 | Bit 1 | Bit 0 | Byte Value |
|---|---|---|---|---|
LAND | 0 | 0 | 1 | 1 |
WATER | 0 | 1 | 0 | 2 |
CLOUD | 1 | 0 | 0 | 4 |
So far it is easy. But you can have clouds over water, for example. Then the byte value or flags value would be a combination of both single flags (here 6).
If you now are just confronted with the value 6 how can you find out which flags are set? Usually, this is done by SNAP for you and the flags are shown in the Pixel Info View.
But sometimes you need to do it on your own, e.g in your own code. (SNAP offers also easy solutions for this case).
To find out which flags are set you need to do bit operations the value.
if (LAND & flags_value == 1) {
// LAND is set
}else if (WATER & flags_value == 2) {
// WATER is set
}else if (CLOUD & flags_value == 4) {
// CLOUDis set
}
For further details please have a look at the Wikipedia pages about Bits and Bitwise operations
What is the difference between flags and masks?
For a description of Flags see the question ‘What are flags and how should I interpret them?’.
Masks are often based on flags. This allows you to mask water pixels in your data, for example. But masks can also be defined differently. For example, by an expression or by a drawn rectangle or by a shapefile which has been loaded. Masks are often used as a Region-Of-Interest (ROI). For instance, when computing statistics in SNAP you can select a mask as the ROI. Then the statistic is only computed with the ROI.
Why do the pixel values differ after export to GeoTiff compared to those in SNAP?
This can have various reasons.
Please select the band in the Product Explorer and select from the Menu > Analysis > Information. Please carefully check the entries on Geophysical data type vs. Raw data type (how SNAP displays the data vs. how the data is actually stored, e.g. Sentinel-2 bands are stored as 16-bit integers (full numbers), but displayed as 32-bit float (decimal values)
Scaling factor and Scaling offset (the factor defines if the actual pixels are multiplied by a constant, e.g. Sentinel-2 bands are multiplied by 1.0E4 (divided by 10000) so the pixels are displayed as reflectance between 0 and 1)
No-data value (defines which pixels are displayed transparently in SNAP)
Valid-pixel expression (allows to mask out pixels in SNAP according to a logical or mathematical expression)
→ All these definitions are only valid in SNAP and not considered when exporting to GeoTiff or other external formats. They must be taken into consideration accordingly.As every external format has its own specifications on the maximum file size and detail, conversion errors can occur (e.g. 16 bit (0-32786) before conversion vs. 8 bit (0-255) after conversion).
Please also have a look at this tutorial: Export of products from SNAP
Related questions
Why should I stick to the BEAM DIMAP format as long as possible?
I want to use a product processed in SNAP in another software
How can I export pixel value for specific points?
In SNAP you have different ways to do this. It depends on your needs which way to go.
You can set Pins at the pixel location you are interested in. and then use the functionality of the Pin Manager to export the values. Have a look at the SNAP help for details.
You can draw geometry on the image and then export the pixel of the transect. Right-click on the image view and then select 'Export Transect Pixels'.
This will export only the pixels of the outline of a geometry.You can draw geometry on the image and then export the pixel of the transect. Right-click on the image view and then select 'Export Mask Pixels'. This will export the whole area covered by the geometry.
You can also export the Product as ASCII file. Select from the menu File / Export / CSV. Make sure that you create a subset of your product and tailor the product to the region you are interested in. The exported files are getting very big quickly.
In the menu at Raster / Export /Extract Pixel Values is another option available. Here you can define multiple coordinates by geo-location (and time) and extract the values from a stack of data products. This operation can also be invoked from the command line via the got tool. Have a look at the SNAP help for details.
The help pages are not showing up when clicking on the help button?
Sometimes it can happen that one plugin breaks the whole help system. Provide the list of installed plugins in the forum along with the problem description. A developer can have look at your problem.
Open in SNAP Desktop the plugin dialogue and switch to the Installed tab and make a screenshot.
On the command line you can follow what is written on this page: Update SNAP from the command line. Perform what is written in the “List all modules” section.
Where can I find tutorials on SNAP?
Many tutorials a linked on the STEP page in the Tutorial section. More guides und how-tos can be found in the SNAP wiki.
How to maintain GPT performance as fast as possible?
For best performance, it is good to have a lot of RAM available. The amount the gpt tool can use, can be adjusted in the gpt.vmoptions file.
Related questions
How do I specify intermediate and final output file names or do I need to specify the file names?
In order to write intermediate results to disk you need to add the Write operator to the graph. For the final result a Write operator is added automatically to the graph by gpt. So, all you need is to specify the target on the command line.
How to best batch the gpt e.g. using just DOS-batch or using python
For batch processing there is an example available in our SNAP wiki.
For python there are meanwhile some examples available in this forum. Probably reading this thread (Example script for multiple operations?) will help you.
But you can also do batch processing from the Desktop application. See in the menu at Tools --> Batch Processing.
It depends on you what you like most.
Related questions
Are there recommended graphs or example graphs available?
Recommended graphs can be found in the Graphs menu of the Graph Builder.
Related questions
A process related to digital elevation models is taking forever to finish
In January 2021 the source for SRTM 3Sec data which are automatically downloaded by SNAP has changed. Since then, SNAP tries to access the resources, but cannot find them any longer. This affects the following tools:
Range Doppler Terrain Correction
SAR Simulation and SAR Simulation Terrain Correction
S1 BackGeocoding
Topographic Phase Removal (also contained in Interferogram formation)
Orthorectification
Land/Sea Mask
Add Elevation Band
StaMPS export (should not require elevation data but still wants to establish a connection)
and potentially other operatos which try to acceess digital elevation data, for example like this

This will be fixed by an update soon which leads SNAP to the new location of these data. Until then, you can help yourself by the following solutions:
Solution: Please update SNAP, the update from 03.02.2021 (v 8.0.3) fixes the problem.
Alternative 1: Select SRTM 1Sec (AutoDownload) instead whenever possible. These should work regardless of the location of SRTM 3Sec data.
Alternative 2 (no longer required, the update fixes it): You can tell SNAP the new location of the SRTM 3Sec data like this:
Go to your SNAP installation directory (e.g. C:\Program Files\snap) and go inside the ect folder where you find the file
snap.auxdata.propertiesOpen it with a text editor (maybe needs administrator privilleges) and go to line 27 which defines the location of SRTM 3Sec data. Change it from
DEM.srtm3GeoTiffDEM_HTTP = http://cgiar-csi-srtm.openterrain.org.s3.amazonaws.com/source/
toDEM.srtm3GeoTiffDEM_HTTP = http://skywatch-auxdata.s3-us-west-2.amazonaws.com/dem/SRTM90/tiff/Save the file and restart SNAP.
The processes should then work again. If you still encounter issues, it might be that SNAP has already downloaded parts of the elevation file but could not finish the download, leading to incomplete or corrupted files. You can solve this by manually deleting them. You find the automatically downloaded digital elevation models in your user directory (user\.snap\aux\dem\SRTM 3Sec) where zip files are stored (e.g. srtm_35_05.zip). Once you delete all of them, especially the ones which are only 1 KB large, SNAP will re-download all tiles required for the processing of an product, and the process should finish as usual.
S1TBX
What SAR missions are supported?
The following SAR missions are supported:
ALOS -1 PALSAR
ALOS-2
Capella
Cosmo-Skymed
ENVISAT ASAR
ERS-1
ERS-2
Iceye
Kompsat-5
NovaSAR-S
PAZ
Radarsat-1
Radarsat-2
Radarsat Constellation Mission
RISAT-1
SAOCOM
Seasat
Sentinel-1
TanDEM-X
TerraSAR-X
UAVSAR
Future missions to be supported include:
Kompsat-6 (2020)
NISAR (2022)
BIOMASS (2022)
Where can I find tutorials on radar processing and analyses?
ESA tutorials: http://step.esa.int/main/doc/tutorials/
Copernicus Research and User Support (RUS): https://rus-copernicus.eu/portal/the-rus-library/learn-by-yourself/ (RUS lectures)
ESA polarimetry course 2019: http://polarimetrycourse2019.esa.int/
ESA Land Training 2019: http://landtraining2019.esa.int/
ASF data recipes: https://asf.alaska.edu/how-to/data-recipes/data-recipe-tutorials/
Echoes in Space: https://eo-college.org/resources (free registration required)
EO4Society: https://eo4society.esa.int/training-education/
NASA webinars and tutorials: https://earthdata.nasa.gov/learn/user-resources/webinars-and-tutorials
NASA ARSET: https://arset.gsfc.nasa.gov/
MIT lecture: https://www.ll.mit.edu/outreach/introduction-radar-systems
UAF lecture: https://radar.community.uaf.edu/
SARTutor: https://sar-tutor-en.iosb.fraunhofer.de/ (login: student, pw: student)
Youtube channels:
Terrain Correction, Terrain Flattening or TOPS Coregistration produces blank images with SRTM 3sec DEM
With SNAP versions prior to 6.0.5 the URL to the SRTM 3sec data is broken therefore it cannot download the dem from that location. Please update SNAP to the latest version. In case you develop operational routinges and require a specific version of SNAP, you can update the .snap/etc/snap.auxdata.properties to fix the URL.
For best results in Terrain Flattening, SRTM 1Sec (AutoDownload) is recommended.
Please also check if your product lies inside the coverage of the SRTM mission: https://www2.jpl.nasa.gov/srtm/coverage.html
S1 TOPS Coregistration takes much time or even fails
The "S1 TOPS Coregistration" module is a chain of multiple separate operators (Orbit File, Split, BackGeocoding, ESD). Each output of one operator is the input for the next operator. As none of these outputs is physically written before the final output product, the "S1 TOPS Coregistration" consumes much of the computer's RAM. Even if your computer has 16 GB of RAM or more, this is often not sufficient to execute all steps in sequence, especially when you select many bursts in the Split operator. If the "S1 TOPS Coregistration" keeps to fail, it is recommended to execute all steps separately, especially reduce the number of bursts as much as possible and make sure that you only use VV polarization. This is usually much faster than executing the coregistration as a graph.
Related questions
In what order should I apply calibration in my processing?
Calibration usually requires the application of look up tables (LUT) provided in the product. These LUTs correspond to the original pixels in the product. Therefore, calibration should be applied prior to any filtering or resampling of the data.
In what order should I apply terrain correction in my processing?
Terrain correction applies a map projection as well as interpolation to correct for layover, foreshortening and shadow. It's generally advised to perform terrain correction late in your processing chain such that filtering and classification is performed on the image in SAR geometry.
What are the general processing steps for polarimetric processing?
Polarimetric processing requires dual pol, compact pol, or quad pol SLC data. Calibrate the SLC data enabling the parameter to output complex data. Apply polarimetric matrix generation, polarimetric speckle filtering, polarimetric decomposition or classification and finally terrain correction. Please find detailed instructions in this tutorial: SAR Polarimetry and Analyses
I created a graph, but it takes very long to finish
The graph builder helps to combine multiple operators to a longer processing chain. It allows to define processing steps and save the workflow as a XML file. This is especially helpful if you want to apply the same processing to a series of input products (Batch Processing). However, graphs files are not very efficient regarding RAM and data in the cache. There are some options to increase the RAM which can be used by SNAP (see below under 'Related questions'), but it is limited by the RAM which is installed in the computer.
More advanced users are recommended to have a look at the Tile Cache Operator to speed up processing graphs: How to Use Tile Cache Operator to Improve Memory Consumption
Graph files are not recommended for the analysis of single products, because of the following reasons:
Executing a graph can take much longer than executing the involved steps individually. This is especially the case for very large graphs.
Graphs do not show the intermediate products. It is hard to keep track of the processing chain in case of errors. Again, executing steps one after another and checking their outcomes gives you more control on the analysis.
Accordingly, working with graphs is most efficient on machines with large computing capacity and for the automation of workflows (e.g. to apply the same processing on multiple images).
Related questions
Why are SAR images flipped?
SAR images are displayed and processed in the SAR acquisition geometry. Depending on if the satellite is in an ascending or descending orbital pass and right or left facing, the image may appear as flipped when compared to the typical North is up convention. After the map projection step in terrain correction, images should appear in the correct orientation for the desired projection.
How can I derive a DEM from SAR data?
Radar interferometry (InSAR) allows to retrieve surface heights from a pair of complex SAR images. There are many things to be considered, for example, the selection of images with suitable acquisition dates and geometries. If you are new to InSAR, please have a look at the documents compiled by ESA: InSAR Principles - Guidelines for SAR Interferometry Processing and Interpretation (ESA TM-19):
Part A is for readers with a good knowledge of optical and microwave remote sensing, to acquaint them with interferometric SAR image processing and interpretation.
Part B provides a practical approach and the technical background for beginners with InSAR processing.
Part C contains a more mathematical approach, for a deeper understanding of the interferometric process. It includes themes such as super-resolution and ERS/Envisat interferometry.
One crucial point to understand is that radar interferometry is very sensitive to various parameters which make the results unusable. Movement of objects at the ground and water vapour in the atmosphere lead to noise in your data. Especially vegetation on the ground leads to temporal decorrelation of the phase. It is therefore important to check the quality of the products after each step (coregistration, interferogram formation, phase filtering, unwrapping, conversion to height), because errors which occurred at early stages are propagated throughout the entire processing.
Because of the sensitivity of the phase towards the movement of canopies, is not possible to extract the heights of vegetation from a single image pair with repeat-pass interferometry (images acquired at different dates). Accordingly, any DEM will have errors over vegetated areas. The severity of these errors depends on the acquisition geometry (a perpendicular baseline of 150 - 300 meters is recommended) and the time which has passed between both image acquisitions. Currently, the 6-day revisit cycle of Sentinel-1 does not allow to create reliable DEMs of most of the earth's surface. Please also have a look at this comment.
Please have a look at the following tutorials on radar interferometry:
Sentinel-1 Stripmap Interferometry (DEM generation)
Interferometry Tutorial with Radarsat-2 (DEM generation)
Sentinel-1 TOPS interferometry (surface subsidence)
InSAR Displacement mapping with ERS data (surface subsidence)
Related questions
I have performed an InSAR analysis, but the result is not correct
SAR interferometry can deliver exact measurements of the earth's surface and its deformation, but it is prone to a number of error sources which can affect the result:
Temporal phase decorrelation (time between master and slave image is too long)
Atmospheric disturbance and ionospheric delay (atmospheric artifacts in the phase, e.g. caused by rainfall during image acquisition)
Unsuitable perpendicular baseline (distance between the position of the satellites at the time of image acquisitions is either too large or too small)
Inaccurate coregistration (master and slave image are not overlayed precisely)
Unwrapping errors (low coherence areas lead to random unwrapping results)
...
If the conditions for InSAR (little to no vegetation, suitable baseline, no rainfall during image acquisitions,...) are not given, your interferogram will contain noise and artifacts and not produce accurate results. You should keep an eye on the coherence as an indicator for the quality which can be expected from your product. Low coherence will mostly lead to unusable results.
Please have a look at these slides on InSAR error sources (accessible after free registration).
Related questions
I want to measure landslides using DInSAR
Although radar interferometry allows measuring surface changes, it is not a suitable technique for rapid or abrupt processes such as landslides, erosion, rockfalls etc. because of the following reasons:
These processes are non-coherent changes, which means that they alter the surface characteristics of the investigated surfaces. This leads to changes in scattering mechanisms and finally to decorrelation of the phase. DInSAR does not work for areas which are covered by vegetation (volume decorrelation) or areas which have undergone significant changes.
The maximum displacement occurring between two images is determined by the wavelength of the sensor. Even coherent processes which exceed the length of the wave (e.g. 5.6 cm for Sentinel-1) cannot be measured reliably.
Atmospheric disturbances can furthermore introduce fringe patterns which are not related to surface displacement, so it is important to have images with suitable (dry) atmospheric conditions.
The amount of measured displacement is also dependent on the looking direction and incidence angle because the displacement is measured along the line of sight (LOS). It is worth spending some time searching for a suitable image pair which captures the movement relative to the sensor best possible.
An alternative to DInSAR for measuring mass movements is the offset tracking module in SNAP.
Related questions
I calculated displacement with DInSAR, but the resulting range of values is unrealistic
This can have two reasons:
Processing errors. Radar interferometry is very sensitive to many potential error sources. Especially if the interferogram quality is not good, unwrapping will produce false results (both regarding their spatial patterns and the value ranges of the displacement) or induce unwanted ramps. Please carefully have a look at this question: I have performed an InSAR analysis, but the result is not correct
Even in case of good data quality (high coherence and clear interferogram patterns), it is important to understand that only relative displacement between two images is calculated. The resulting raster can still contain a general offset which has to be corrected manually. To do this, you identify an area where you do not expect surface displacement with high coherence, read its displacement value (e.g. 15 mm per year) and add this offset to the original displacement raster in the Band Maths. The result will be a displacement raster corrected for this offset. An example is given in this tutorial (chapter "Check and correct for offsets").
To determine the offset in your displacement product, it is not recommended to look at extreme values. Minimum and maximum values are often only statistical outliers and produced in cases of unwrapping errors. Instead, digitize a line across both stable and changing areas in the raster (as explained in this tutorial, Figure 26) to check the pixel value in areas which are expected stable. The offset in these areas should be zero, so the value they show should be added or subtracted to the result. Please also have a look at these discussions in the forum
Related questions
I want to extract soil moisture from SAR data
Although backscatter intensity is correlated with the moisture of a surface or volume (Figure 8), there is no constant relationship between these two parameters, because backscatter intensity is also affected by further parameters, such as surface roughness or vegetation cover. The retrieval of soil moisture from radar data, therefore, requires a study design which includes the collection of soil moisture measurements in the field (at the time of image acquisition), the application of multiple input images, or the integration of polarimetric information. Many approaches have been published on this topic, but there is no standardized way of soil moisture retrieval at high resolution. Global products exist at the spatial resolution of 500 meters or 1 kilometre (SMOS, ASCAT).
Please also have a look at these discussions in the forum:
Also great materials on soil moisture and SAR are provided by the EO College: https://eo-college.org/resource/soil_moisture/ and https://eo-college.org/resource/soil_moisture_tutorial/
There are operational soil moisture products hosted at the NASA Earthdata portal (please consult the "collection details" of each product to learn about their generation and validity): https://search.earthdata.nasa.gov/search?q=soil%20moisture
On Linux I get the error org.jblas.NativeBlas.dgemm(CCIIID[DII[DIID[DII)V
On Linux the JBLAS library needs a Fortran dependency installed
sudo apt install libgfortran3
S2TBX
What are the difference between products L2A and L2Ap?
L2Ap are the pilot products generated by ESA until March 2018. After March, they are operational products (L2A).
Why some bands are missed in L2A products?
Depending on the resolution selected for the Sen2Cor processing, there are some bands that are not generated:
At 60 m: the band 8 is not used and the band 10 is excluded as it does not represent surface information (the cirrus band).
At 20 m: B08 is not used and the three resampled 60m bands B01, B09 and B10 are omitted.
At 10 m: The 10m product processing covers only the four optical bands at 10m (B2, B3, B4 and B8). The other bands are omitted. If a 20 m processing has already been performed in ahead, these data will be used as input. Else, a 20 m resolution will be performed first, in order to have access to the input data.
For more information see the sen2cor user manual in http://step.esa.int/main/third-party-plugins-2/sen2cor/
What is the difference between the generic Resampling operator and the S2Resampling?
The S2Resampling operator resamples the Sentinel-2 products having into account the particularities of the angle bands.
Because of the discontinuity of the angles when the detector changes, the result of the resampling of the azimuth angle bands is not good from the physics point of view since it blurs the border between detectors when we use a bilinear method. (See a more detailed explanation in the SNAP help).
It is recommended to use the specific resampling only when the angle bands are going to be used later. Else, it is better to use the generic operator since the output is going to be similar and it is much faster.
What tools are available to carry out the atmospheric corrections of Sentinel2 L1C products?
The most used tools that can be used for the atmospheric corrections of Sentinel-2 Level 1C products are:
Sen2Cor: http://step.esa.int/main/third-party-plugins-2/sen2cor/
Sen2Cor is the "official" tool that is used by ESA to generate the level 2 product that can be downloaded directly from Scihub.MAJA: https://logiciels.cnes.fr/en/content/maja
MACCS-ATCOR Joint Algorithm, result of a collaboration between CNES and DLR. It is able to work with time series.iCOR: https://blog.vito.be/remotesensing/iCOR_available
"The atmospheric correction software, iCOR (previously known as OPERA), is now available to the broad user community through the ESA Sentinel Application Platform (SNAP) for the atmospheric correction of Sentinel-2 and Landsat-8 data".C2RCC: https://www.brockmann-consult.de/portfolio/water-quality-from-space/
The main purpose of the C2RCC processor is the retrieval of Inherent Optical Properties (IOP) but it also performs an atmospheric correction over water. If you are only interested in water pixels then you can give it a try. It is included in the Sentinel-3 Toolbox.
Problems when trying to open an S2 product
Usually, the errors occurred when trying to open an S2 image are caused because the format of the product has been updated. When this occurs, we update SNAP in order to support the new format, so please, update SNAP (Menu->Tools->Plugins->Update) and try again.
It has been also reported some problems with some zip tools: some users have had problems when unzipping the products with WinZip. If you are using this tool, try to use another one (7zip for example) or to open directly the zip file.
What are the units of the Biophysical processor outputs?
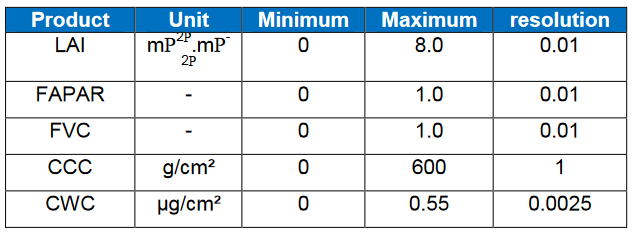
More information about the Biophysical porcessor can be found in the ATBD: http://step.esa.int/docs/extra/ATBD_S2ToolBox_L2B_V1.1.pdf
What bands are required by the Biophysical processor?
The biophysical processor is implemented as a neural network that requires the following bands in the input layer: B3, B4, B5, B6, B7, B8A, B11, B12, view_zenith_mean, view_azimuth_mean, sun_zenith and sun_azimuth.
What cloud masks are available in S2 products?
In L1C products there are some cloud masks:
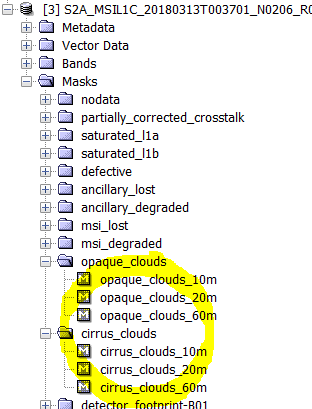
In the level 2A products, the cloud mask are more accurate:
There is a scene classification identifying the cloud pixels
There is also a band 'quality_cloud_confidence'
It exists also in SNAP the operator IdePix that can compute the cloud pixels of a L1C product.
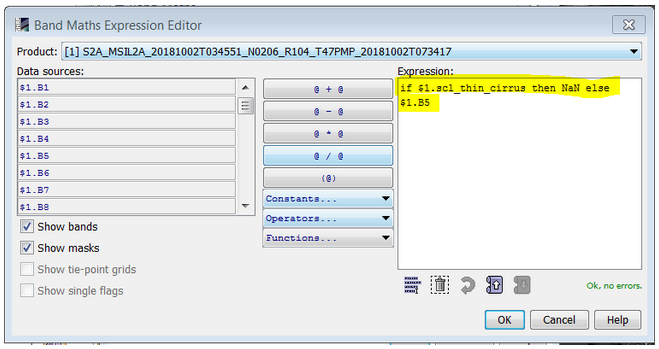
How to remove clouds from a S2 product?
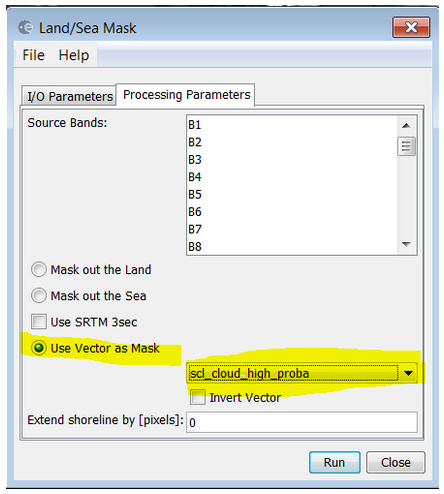
In the S2 products there are available masks indicating the cloud pixels. There are different ways to mask out these pixels in the bands:
right-click on the band in the Product Explorer and write the condition in the Valid-Pixel expression
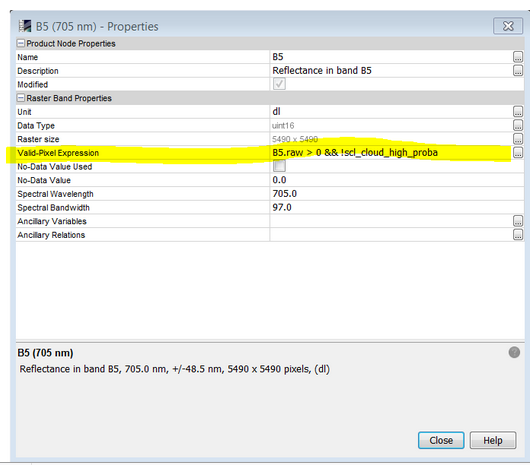
Use the land/sea mask operator (Menu-> Raster->Masks->Lad/Sea MAsk) by using "Vector as Mask" and selecting the desired mask:
Use Band Maths: you can create new bands using as expression for example:
S3TBX
Is a SMILE correction available for OLCI?
No, this is not available. A smile correction as implemented in the OLCI ground segment processor. However, for the OLCI bands 13, 14 and 15 such a standard smile correction is not possible.
But you can have a look at the O2A Harmonisation. You can find at Optical / Preprocessing / OLCI O2A Harmonisation. It tries to harmonise the O2 bands by modifying the effective transmittance in the O2A bands.
Is an atmospheric correction available for OLCI?
The level-2 data provided by ESA/Copernicus/Eumetsat is already atmospherically corrected. If you want to do the AC on your own, you currently have threeoptions:
iCOR: https://remotesensing.vito.be/case/icor
Beside Sentinel-2, Landsat 8 and Proba-V it also supports Sentinel-3 OLCIC2RCC: https://www.brockmann-consult.de/portfolio/water-quality-from-space/
The main purpose of the C2RCC processor is the retrieval of Inherent Optical Properties (IOP) but it also performs an atmospheric correction over water. If you are only interested in water pixels, then you can give it a try. It is included in the Sentinel-3 Toolbox.Rayleigh Correction:
This simplified atmospheric correction procedure is a first attempt to normalise the TOA signal for gaseous and Rayleigh effects, whilst ignoring the more complicated and variable effects of absorbing aerosols. It is available in the menu at Optical / Preprocessing / Rayleigh Correction.
Is there a cloud masking including cloud shadow for OLCI?
You can run Idepix on OLCI. Idepix is a pixel classification. available for multiple sensors. For OLCI a cloud shadow is included. You can install this additional Plugin via the ‘Plugins Window’.
After installation, you can find it in the menu at Optical / Preprocessing / Masking / Idepix.
Are C2X neural nets available for OLCI in the C2RCC processor? If not, are there plans to implement them?
The C2X nets are not available for OLCI. At the time of the C2X project, the training range for the “normal” neural nets was rather restricted to moderately turbid and absorbing coastal waters. With C2X really extreme situations were included, at the costs of good performance in clearer waters. After this exercise, the ranges used for training neural nets for C2RCC, in general, has been extended – not as extreme as in C2X but sufficiently to cover many situations in coastal and inland waters, without scrutinizing clear waters.
Thus, currently, we don’t work on a version of the C2X nets for OLCI but could consider this if there is demand in the community.
Which water-related algorithms are available and for which sensors?
OLCI | VIIRS | SeaWiFS | MODIS | MERIS | S2 | |
|---|---|---|---|---|---|---|
FUB-CSIRO Coastal Water Processor | x | |||||
FLH/MCI | x | x | x | |||
C2RCC | x | x | X | x | x | x |
MPH/CHL Processor | x | x | ||||
MERIS FUB/WeW Water Processor | x | |||||
FU Classification | x | x | x | x | x | |
OWT Classification | x | x |
Sen2Cor
How to install?
Old versions of Sen2Cor were not easy to install, but that has changed in latest versions. Now, you only have to download and unzip it. See http://step.esa.int/main/third-party-plugins-2/sen2cor/ for more details.
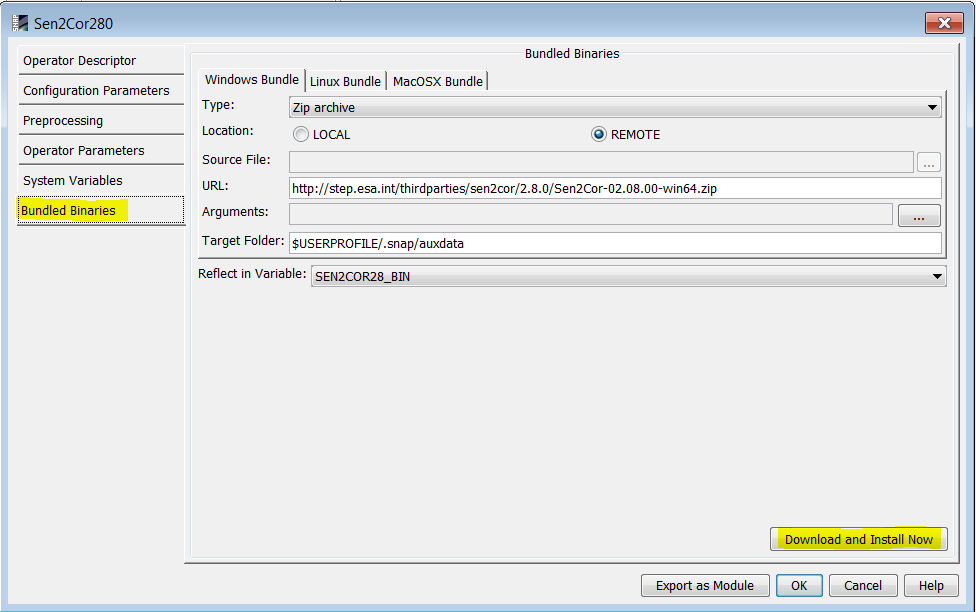
If you are going to use Sen2Cor from SNAP using the Sen2Cor plugin, then the plugin can install it for you. When the plugin is installed in SNAP, in Menu → Tools → Manage External Tools, edit sen2cor and install it from the Bundled Binaries tab:
S2?_MSIL1C*.SAFE but is XXXXXX.zip Error
Sen2Cor does not support the zip format, so if you want to apply it to a S2 product, you have to unzip the product before opening it in SNAP.
AttributeError: 'L2A_Tables' Object has no attribute '_L2A_Tile_PVI_File'
This error appears in some sen2cor versions when trying to execute at 10m resolution. The workaround is to select ALL resolutions when running it from SNAP or to not indicate any resolution when running from command line (this way all resolutions will be computed). It is explained in the SNAP forum: https://forum.step.esa.int/t/sen2cor-02-05-05-win64-attributeerror-l2a-tables-object-has-no-attribute-l2a-tile-pvi-file/9587